Paper chart recorder using an imported thermal printer, no ink consumption, 832 thermal printing points within 104mm, curve recording and digital recording of measured values. The temperature chart recorder is ideal for industries that require detailed and reliable data tracking, such as manufacturing, pharmaceuticals, and environmental monitoring, providing both real-time data visualization and efficient storage solutions.
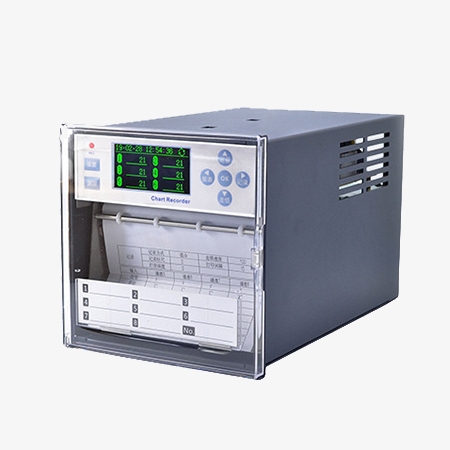
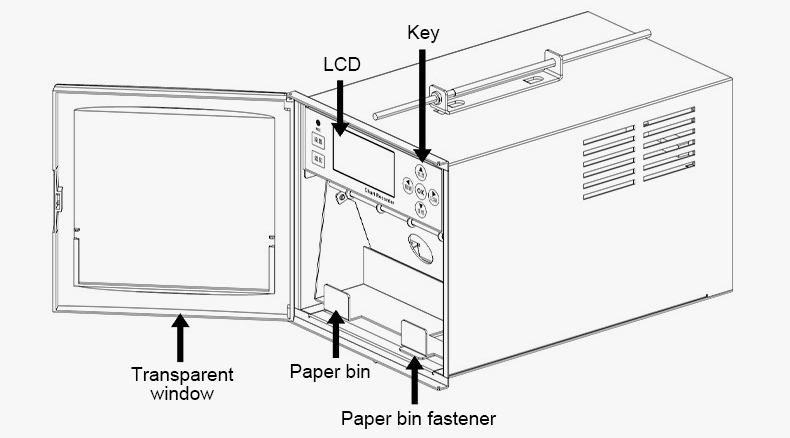
Equipped with a 2-inch high-definition OLED LCD screen which can provide real-time data display
- The 2-inch OLED screen offers a clear, high-definition view of the recorded data in real-time, allowing users to instantly monitor the variables without waiting for the paper chart.
- The high-definition OLED display ensures sharp and detailed visuals, making it easier to interpret data trends directly from the screen.
- Users can view the real-time data on the OLED display while the paper chart continues to record, providing dual monitoring capabilities.
- The OLED screen's intuitive display makes navigating through settings and reviewing data simple, improving user interaction and efficiency.
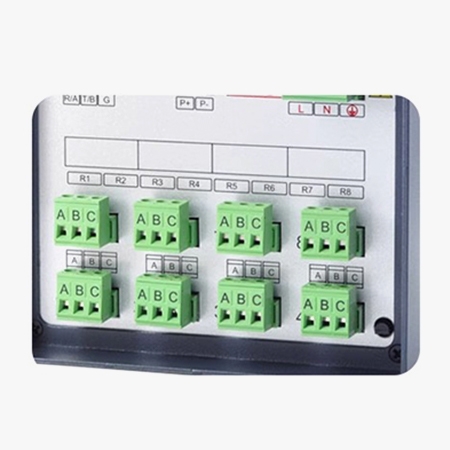
The digital chart recorder featuring 1-12 selectable plug-in terminal blocks
- The recorder supports 1 to 12 channels with selectable plug-in terminal blocks, allowing users to customize the number of inputs based on their monitoring needs.
- The plug-in design of the terminal blocks makes it simple to connect and disconnect sensors or inputs, streamlining installation and reducing downtime for maintenance.
- Users can start with fewer channels and expand up to 12 as needed, making the system adaptable for growing data monitoring requirements.
- The secure plug-in terminals ensure stable data transmission, reducing the risk of errors or interruptions in the recorded data.
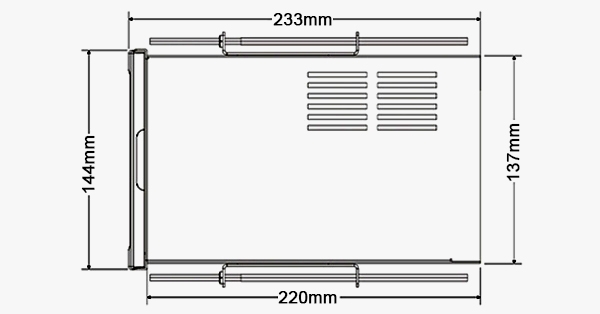
Dimension
Applications
SISCO chart recorder is widely used in industrial and scientific applications to monitor and record variables such as temperature, pressure, humidity, and flow rate over time. Commonly employed in fields like manufacturing, environmental monitoring, HVAC systems, and laboratories, chart recorders help ensure process stability, compliance with regulations, and accurate data tracking for analysis and quality control. Their ability to provide a visual record of changing conditions makes them essential for long-term data monitoring and process optimization.

Environmental Monitoring
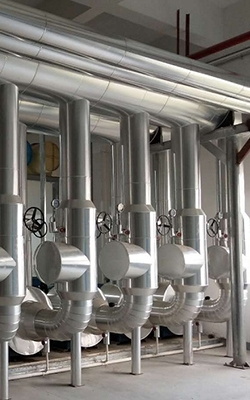
HVAC Systems
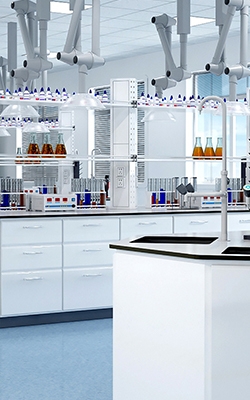
Laboratory
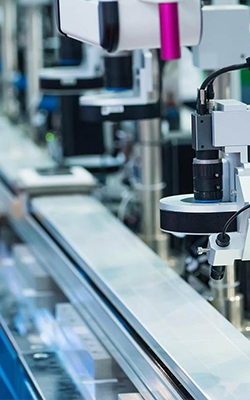
Manufacturing
| Model | SISCO-CR-WPR13R |
| Number of Channels | 1-12 channel input |
| Input Function | Up to 12 channels of signal input, fully isolated input signals, can input current, voltage, thermocouple and thermal resistance and other input signals |
| Recording Function | Adopt imported thermal printer, no ink consumption, no pen position error, anti-vibration; 832 thermal printing points within 104mm; curve recording and digital recording of measured values. |
| Real-time | High-precision clock, power failure does not affect normal timing. |
| Curve Migration Function | By setting the recording boundary, the curve recording of different channels can be separated. |
| Paper Feed Speed | 10-450mm/h free setting |
| Input Signal | Thermocouple: K/S/R/B/N/E/J/T Thermal resistor: Pt100, Cu50, Cu100 Voltage: 0-5V, 1-5V, 1-5V square root, 0-10V Current: 0-10mA, 0-20mA, 4-20mA, 4-20mA square root Millivolt: 0-20mV, 0-50mV, 0-100mV |
| Panel Specifications | 2.5-inch high-brightness monochrome LCD screen |
| Dimensions | 144*144*233mm |
| Weight | 1kg |
Detail
Q1: What is a chart recorder?
A1: A chart recorder is a device used to record data over time, typically in the form of a graph or chart on paper or digitally. It continuously monitors variables such as temperature, pressure, humidity, or flow rate using sensors, and then plots this data on a moving chart, which can be circular, strip-based, or digital. Chart recorders are commonly used in industrial, environmental, and laboratory settings to visually display trends and changes in these variables, ensuring proper control, monitoring, and record-keeping for processes and systems.
Q2: How often should the paper be replaced in a chart recorder?
A2: The paper in a chart recorder should be replaced when it becomes worn out, dirty, or when the current chart has completed its recording cycle and a new chart is needed to continue data logging. Regularly checking the paper for any signs of wear or damage is important to ensure the accuracy and clarity of the recorded data. The frequency of replacement will depend on several factors, including the type of chart recorder being used (such as circular or strip chart recorders), the duration of the recording cycle (daily, weekly, or monthly), and the intensity of use. Keeping the paper fresh and in good condition helps maintain accurate records and ensures the recorder operates smoothly.
Q3: What is the purpose of calibration in chart recorders?
A3: The purpose of calibration in chart recorders is to ensure accurate and reliable measurements by adjusting the device to match known reference values. Calibration involves comparing the chart recorder's sensor readings to standard or certified measurements and making necessary adjustments to correct any discrepancies. This process ensures that the data recorded, such as temperature, pressure, or other variables, accurately reflects the true values. Regular calibration is essential for maintaining precision, especially in applications where precise data monitoring is critical for safety, compliance, or quality control.
Tips: What is the difference between an analog and a digital chart recorder?
The main differences between analog and digital chart recorders are in how they record and manage data:
- Analog Chart Recorder: Records data on paper using pens that physically draw on a chart, either circular or strip-based. It’s straightforward and easy to use but requires regular paper and pen replacement. Maintenance is needed for moving parts like gears, and historical data is stored as physical charts, which can take up space.
- Digital Chart Recorder: Stores data electronically and displays it on a digital screen, such as an LCD or OLED. It provides more precise readings, doesn’t require paper or pens, and allows for easy access to historical data through internal memory or external storage. Digital recorders often come with advanced features like alarms, remote monitoring, and data logging.
In summary, analog recorders are simple but require more upkeep, while digital recorders offer higher accuracy, more features, and easier data management.
Thank you for buying industrial test and measurement equipment on SISCO.com, all products sold by SISCO and the partner cover a 12 months warranty, effective from the date of receiving the products.
What is covered?
SISCO is responsible for providing free spare parts, and free technical support to assist the customer to repair the defective products until the problem is solved.
What is not covered?
- Product purchased from anyone other than a SISCO store or a SISCO authorized reseller.
- Expendable parts.
- Routine cleaning or normal cosmetic and mechanical wear.
- Damage from misuse, abuse or neglect.
- Damage from use of parts other than SISCO approved.
- Damage from use outside the product’s usage or storage parameters.
- Damage from use of parts not sold by SISCO.
- Damage from modification or incorporation into other products.
- Damage from repair or replacement of warranted parts by a service provider other than a SISCO authorized service provider.
- Damage caused by the application environment not meeting the product usage requirements and the failure to perform preventive maintenance.

